Console
Every node with the admin role serves a web console at the root of its admin listener, http://node:9180/. It is embedded in the binary. The console is a client of the Admin API, and any node's console shows the whole cluster.
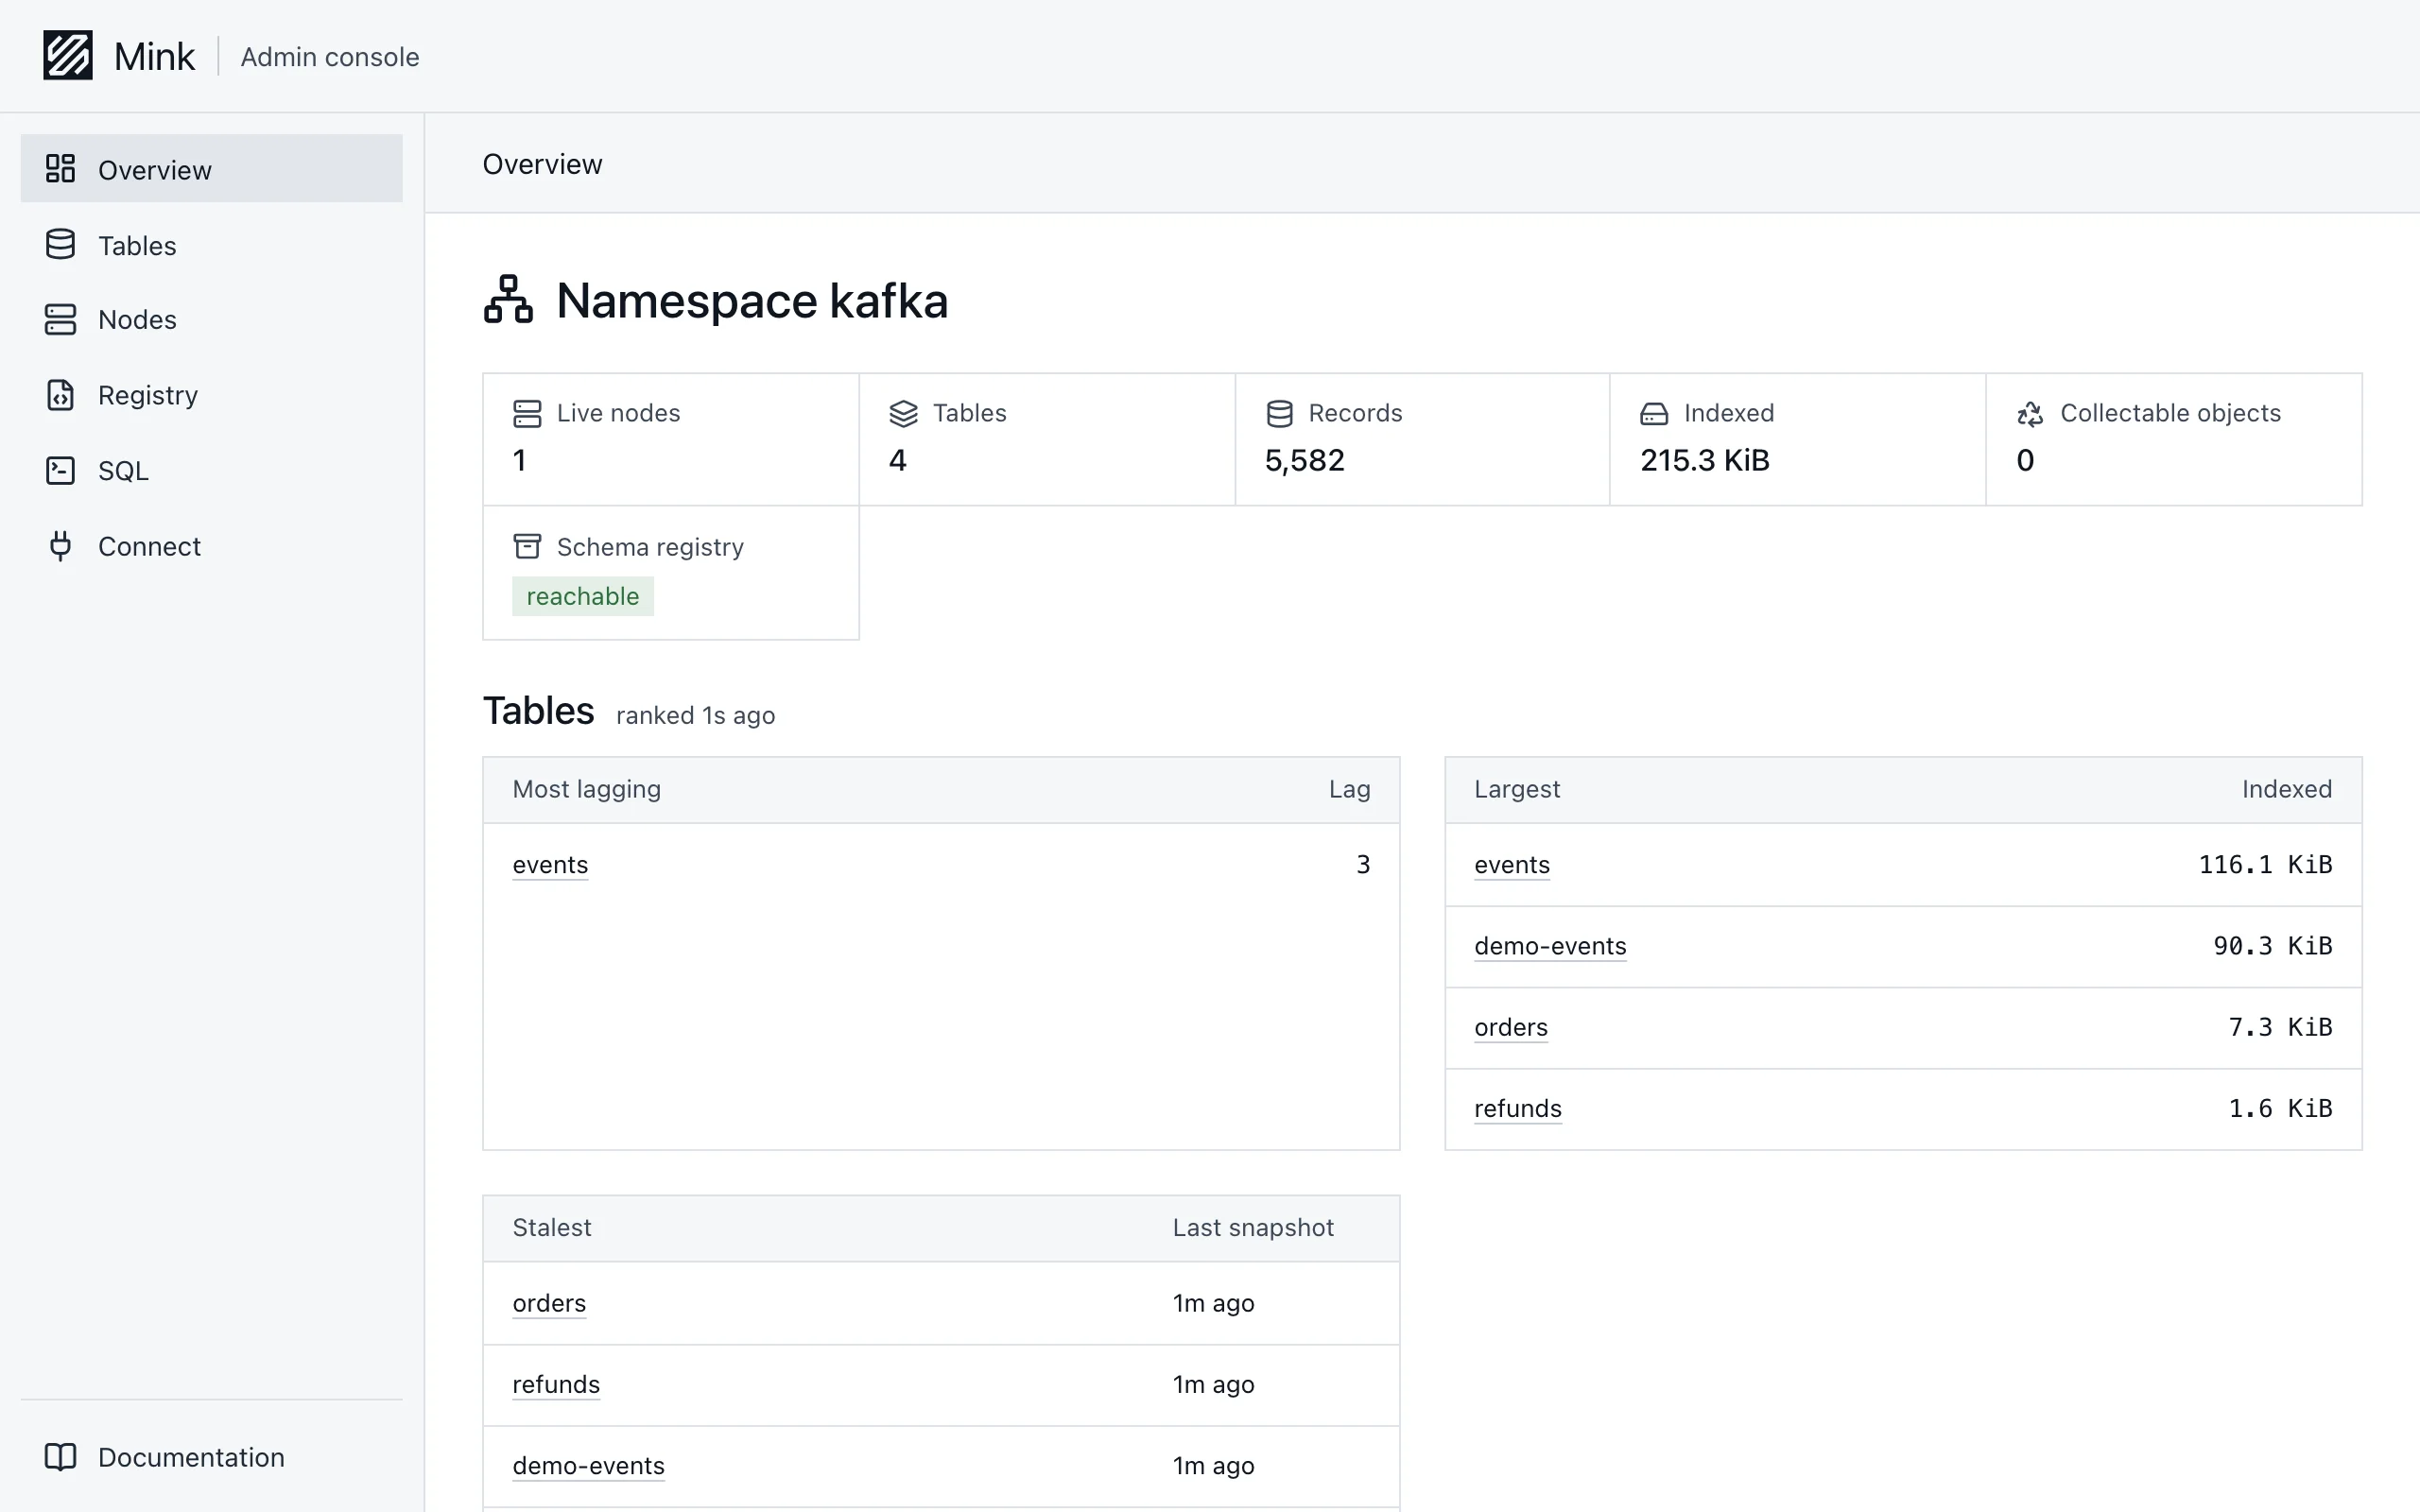
Pages
| Page | Shows | Actions |
|---|---|---|
| Overview | Live nodes, tables, records, indexed bytes, collectable objects and whether the Schema Registry answers. | |
| Tables | Tables with state, partitions, granularity, latest snapshot, records and bytes, with a prefix search | Add table |
| Table | Overview, Partitions, Files, Snapshots, Schema and Records tabs | Change granularity, remove table |
| Nodes | Live nodes with their roles, addresses and lease counts, and a page per node with live charts | |
| Registry | Schema Registry schemas Mink has stored, with their format, references and the tables that use them | |
| SQL | A DuckDB session in the browser over this node's catalog | Run, profile |
| Connect | The catalog URL, namespace, warehouse and S3 endpoint, and settings for DuckDB, PyIceberg, Spark and Trino | Copy |
Pages refresh every 10 seconds.
Tables
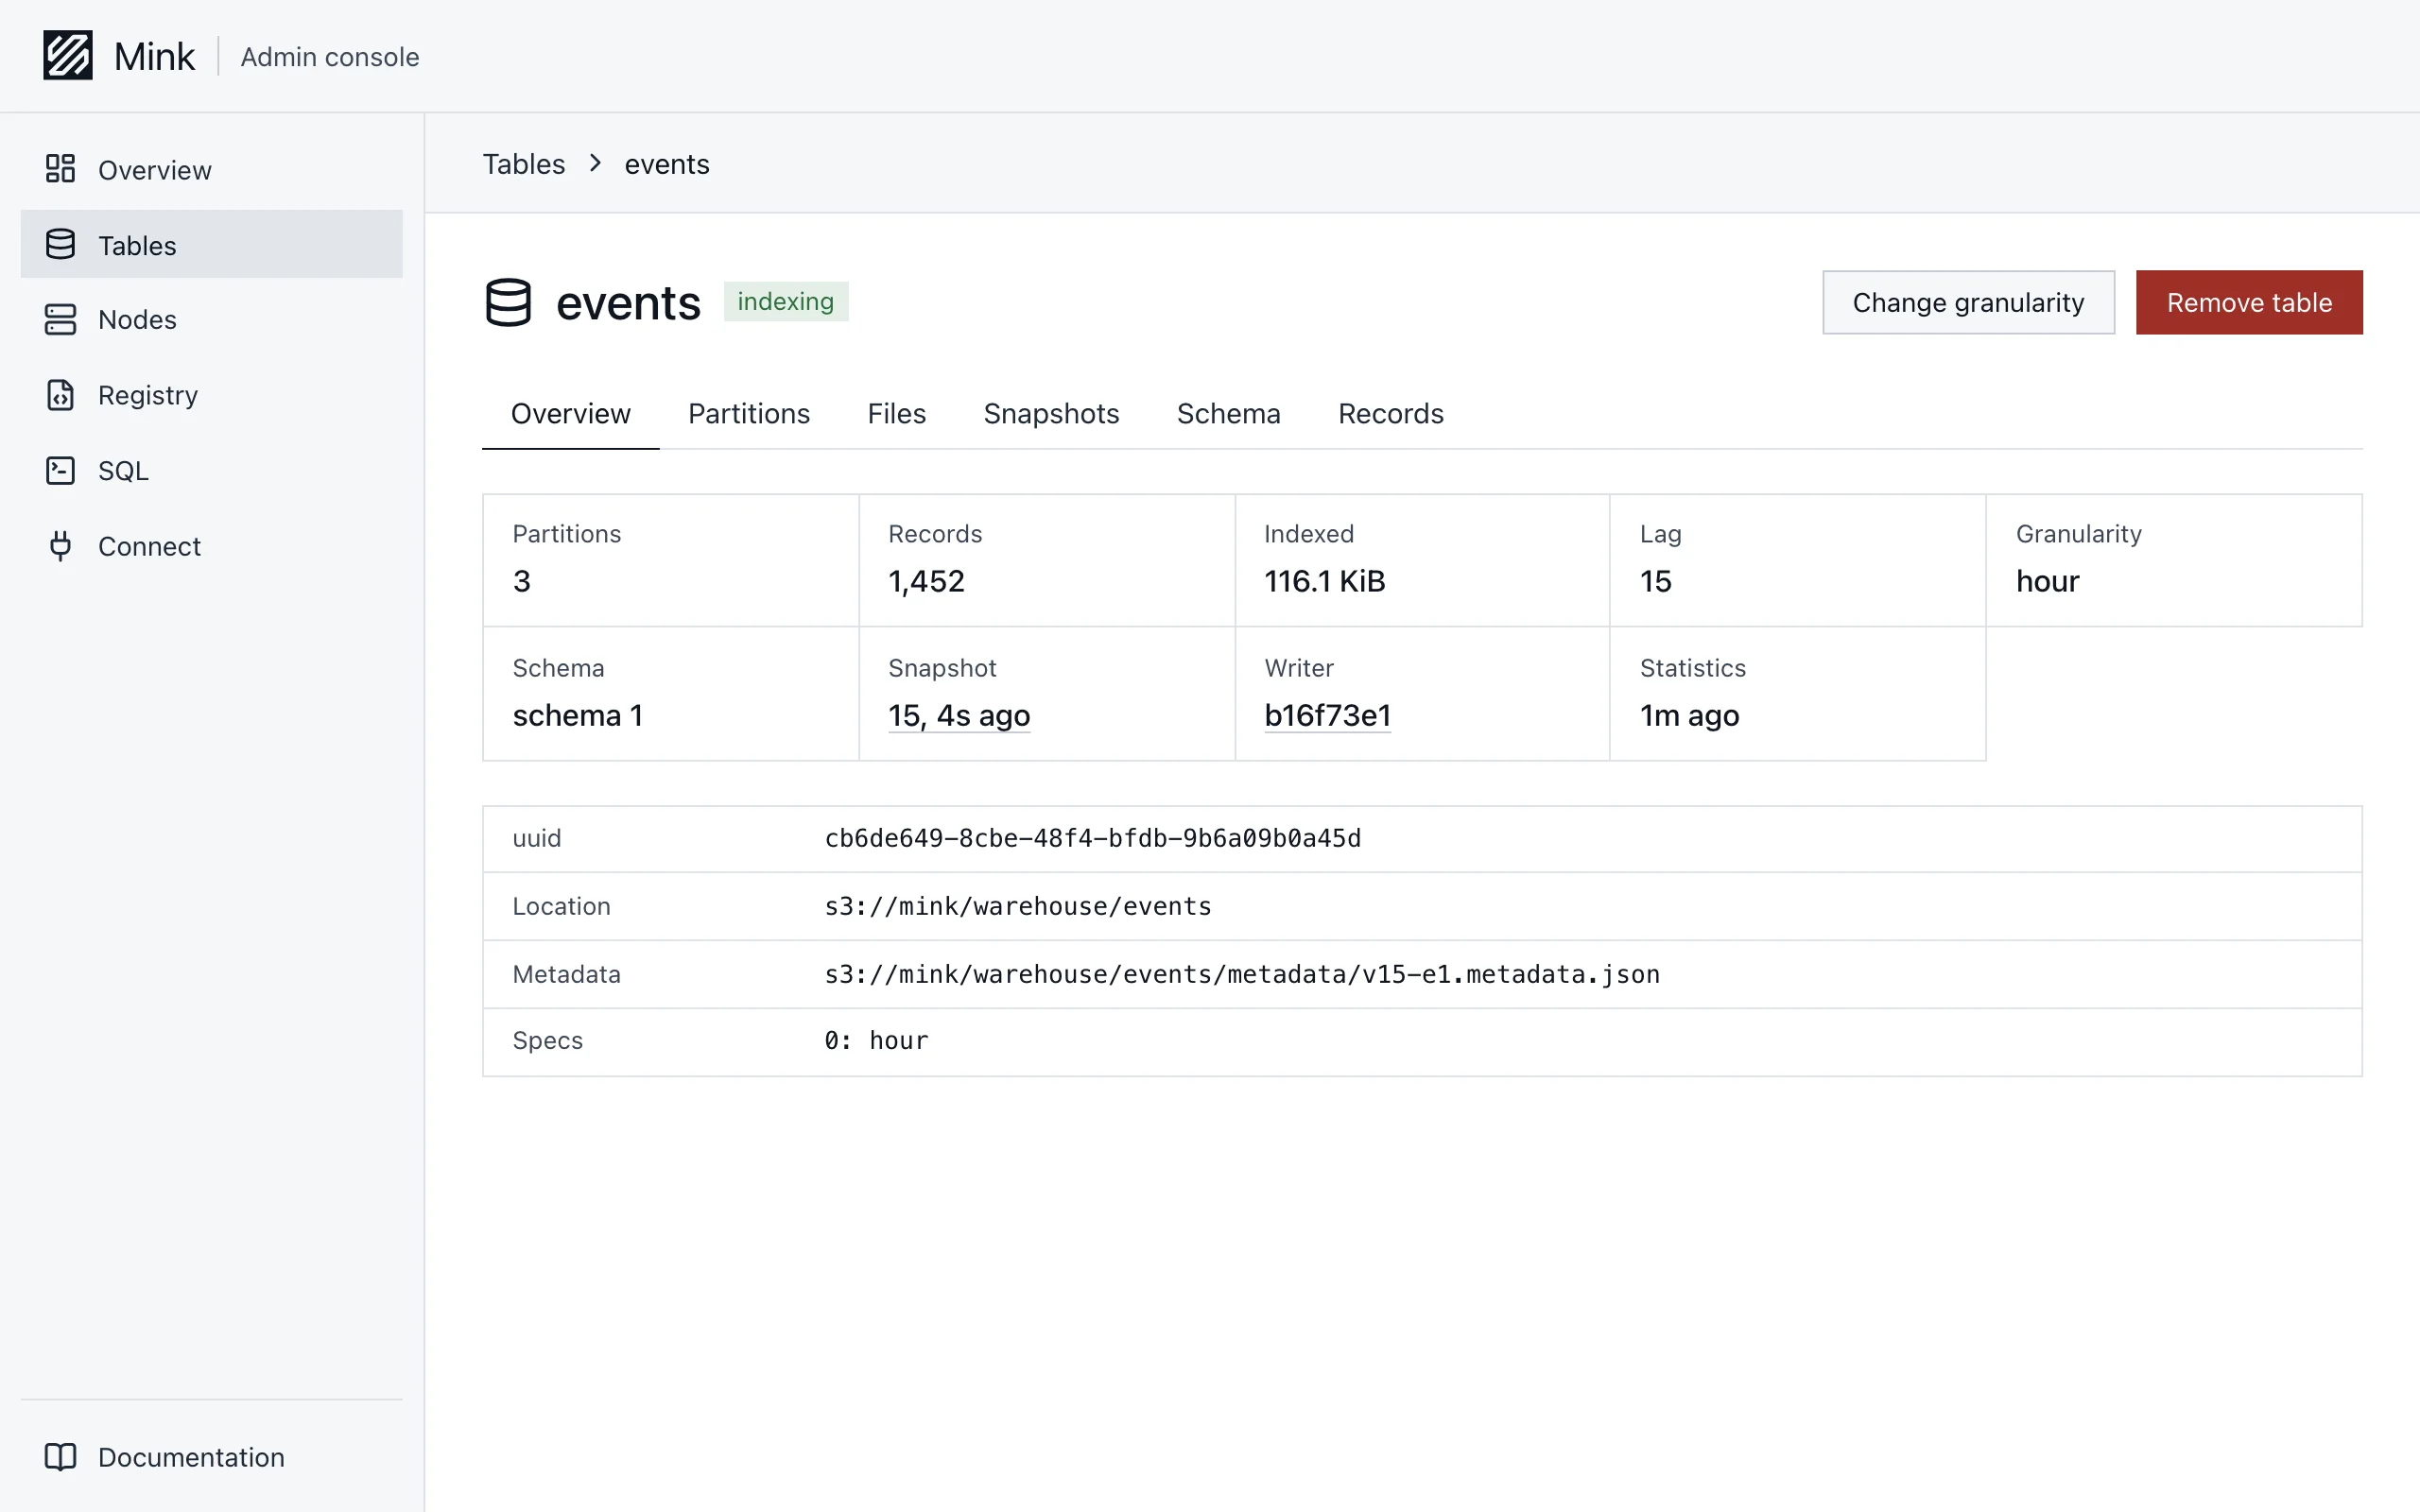
| Tab | Shows |
|---|---|
| Overview | Partitions, records, indexed bytes, lag, granularity, schema, latest snapshot, writer and the last statistics file. Then the table's uuid, location, metadata file and partition specs. |
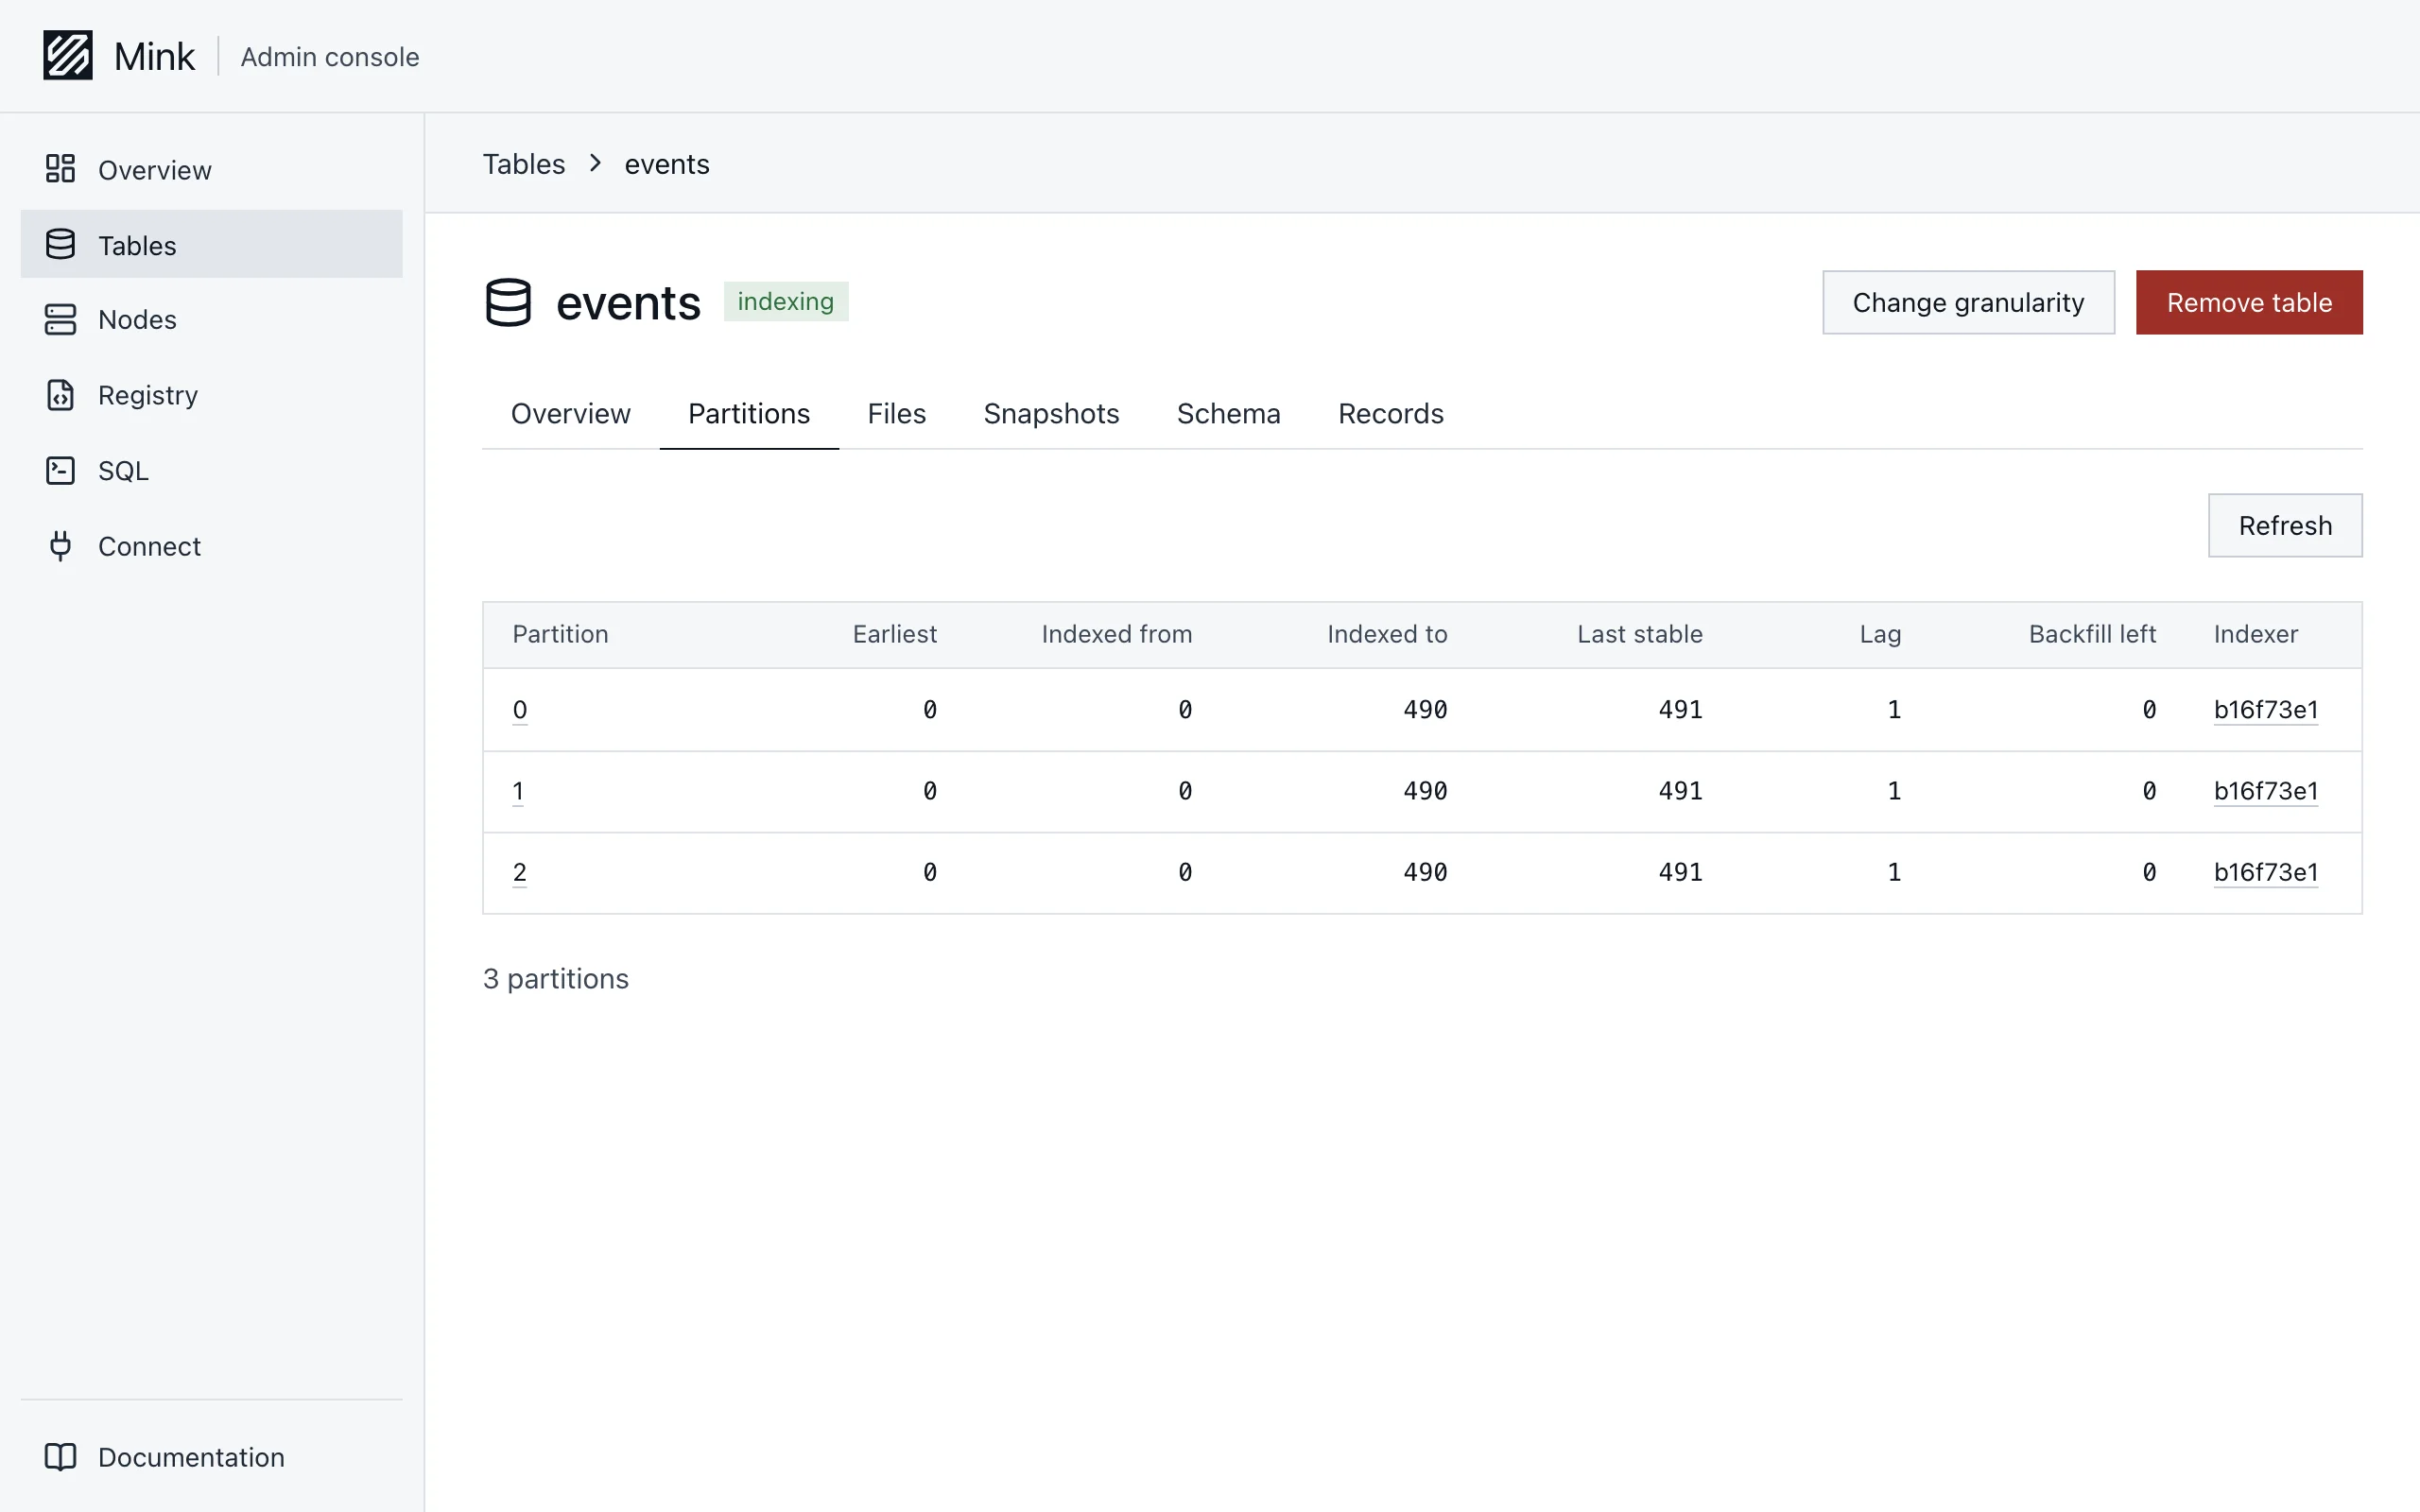
| Partitions | Each partition's earliest, indexed and last stable offsets, lag, backfill left and indexer |
| Files | Live data files with partition, offsets, time bucket, schema, parts, records and size. A file's page shows its path and per-column statistics. |
| Snapshots | Snapshots, newest first, with records and files added and replaced. A snapshot's page shows each partition's offsets. |
| Schema | Every table schema, and every Schema Registry schema that records named, with the schema it merged into or why it was rejected |
| Records | Committed records of one partition, read from Kafka |
Records
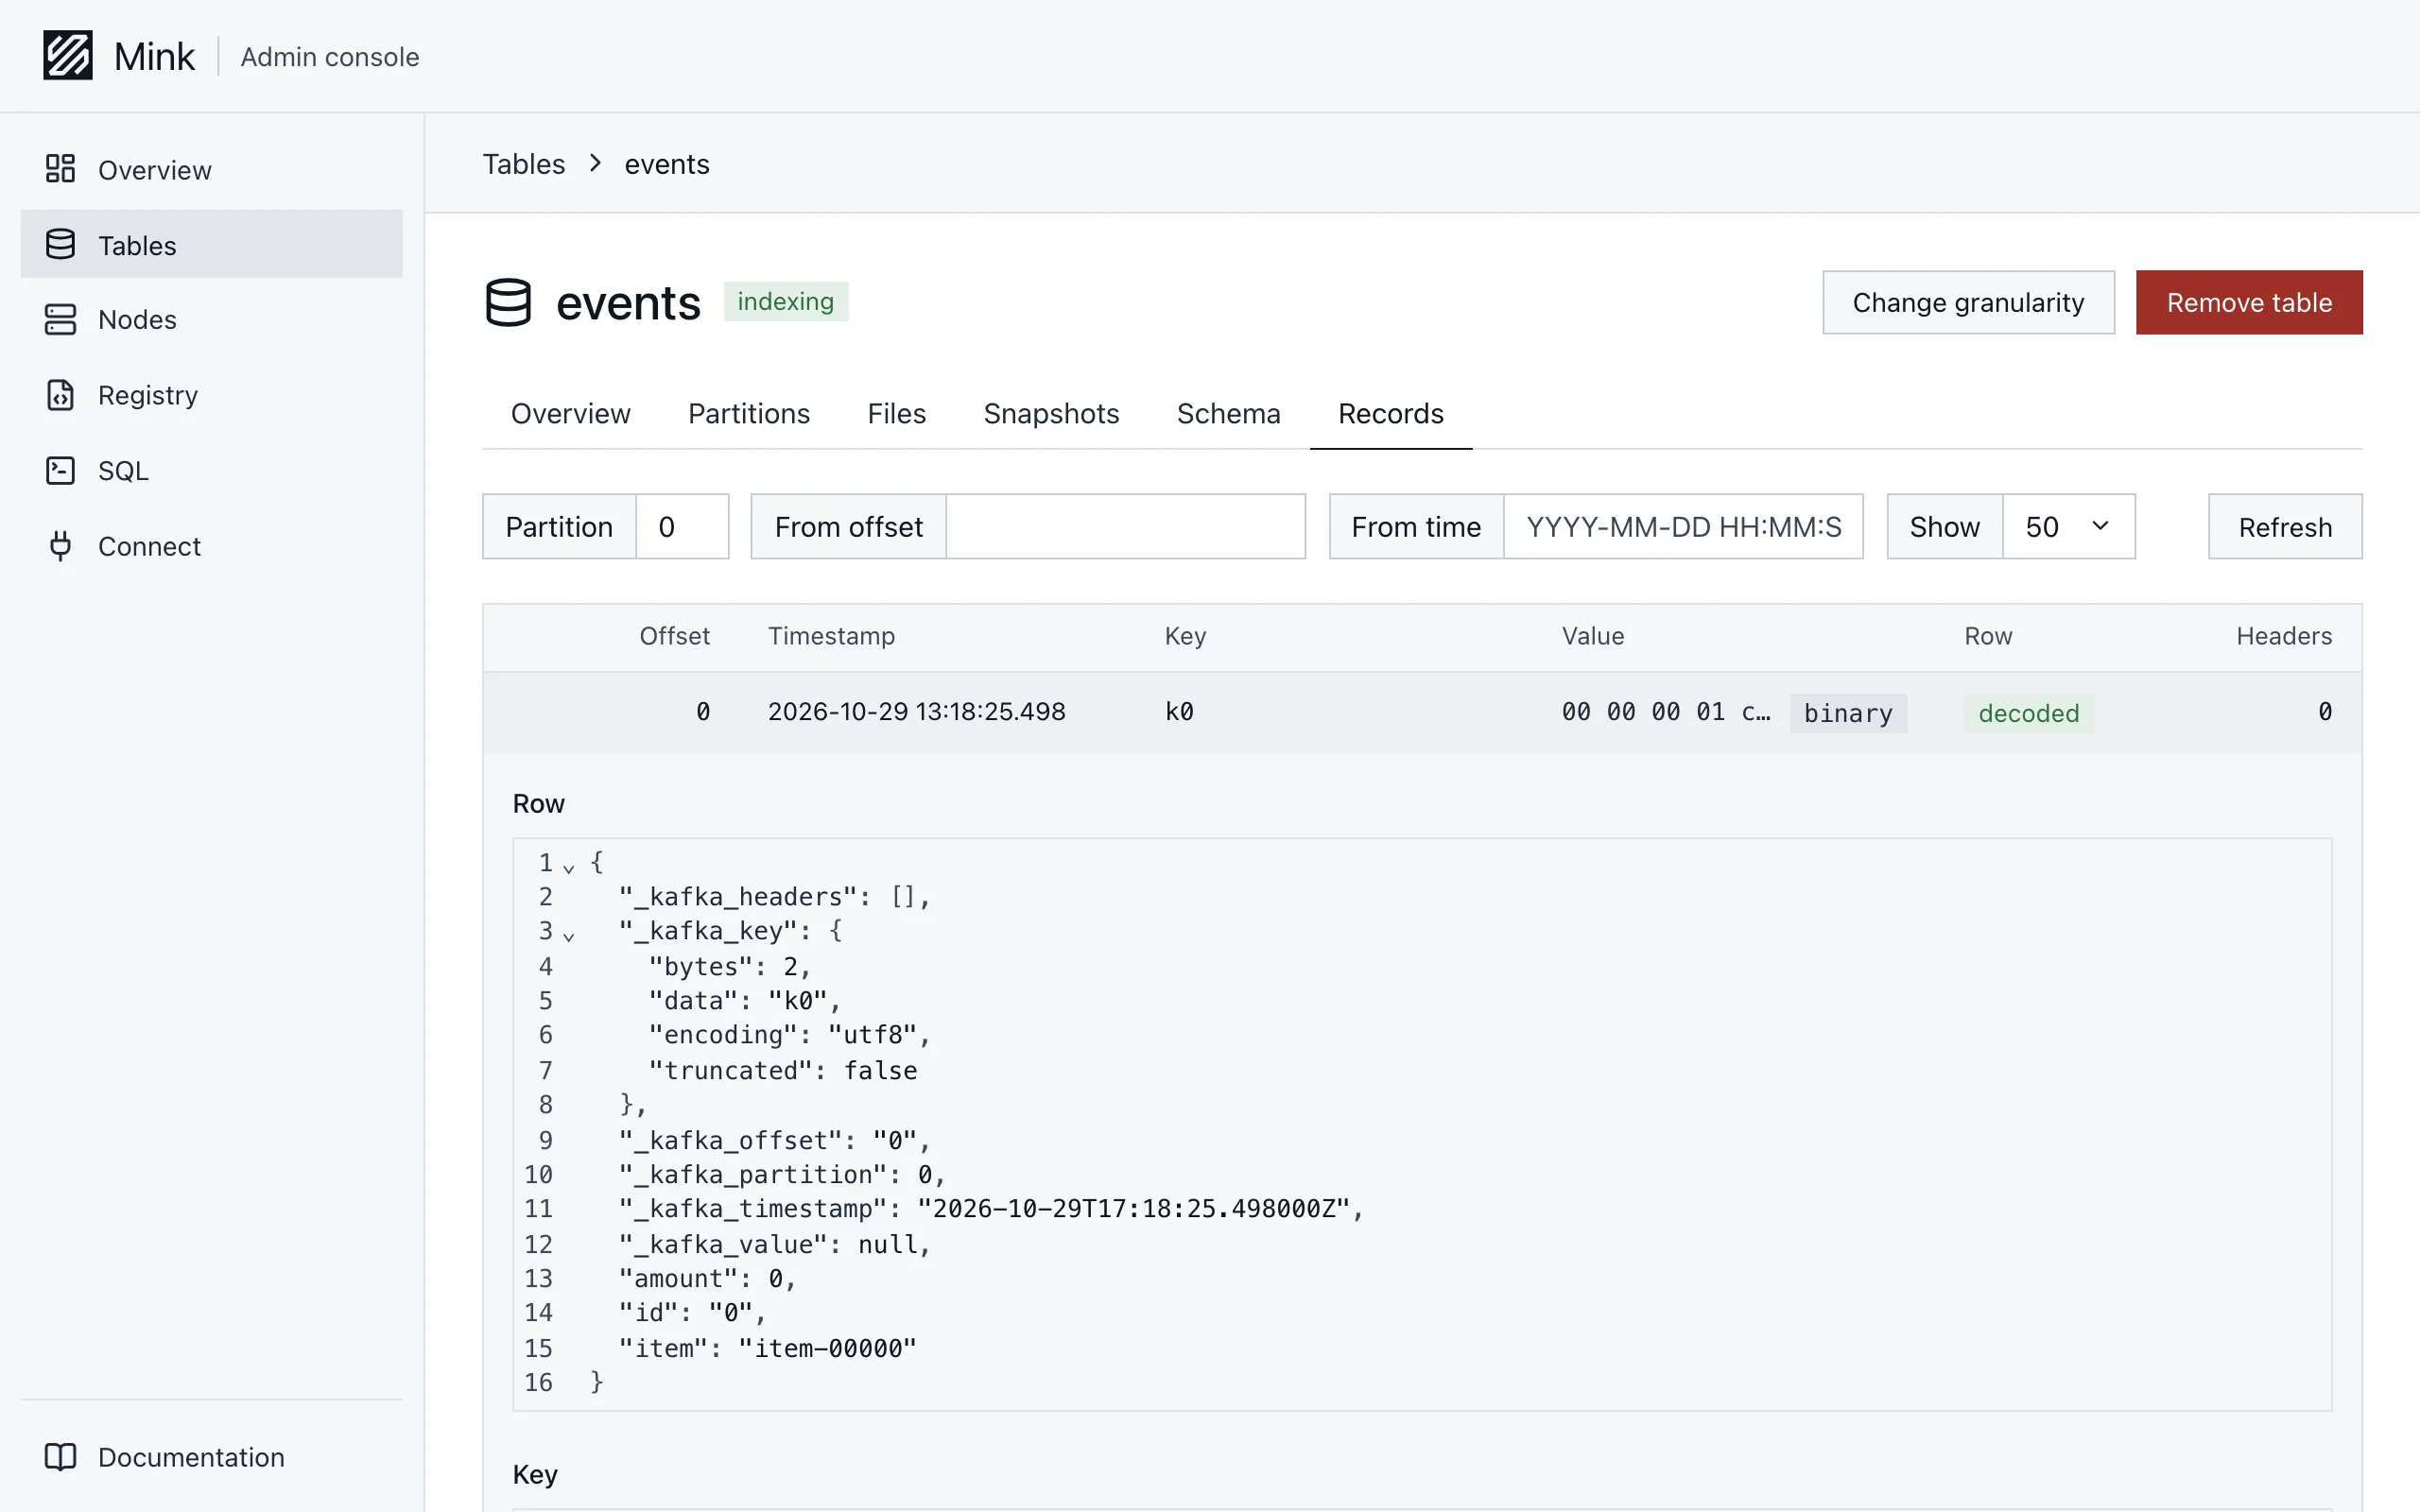
The Records tab browses one partition at a time.
- Start. From offset jumps to an offset. From time jumps to the first record at or after a time.
- Page size.
50,100or500records. Next continues from the offset after the last one shown. - Rows. The Row column shows whether the record decoded into the table's columns. A record that did not decode shows why.
- Records. Clicking a row opens the record in full: the row the table reads, the key and value, formatted when they are JSON, and the headers. Binary data shows as hex.
Nodes
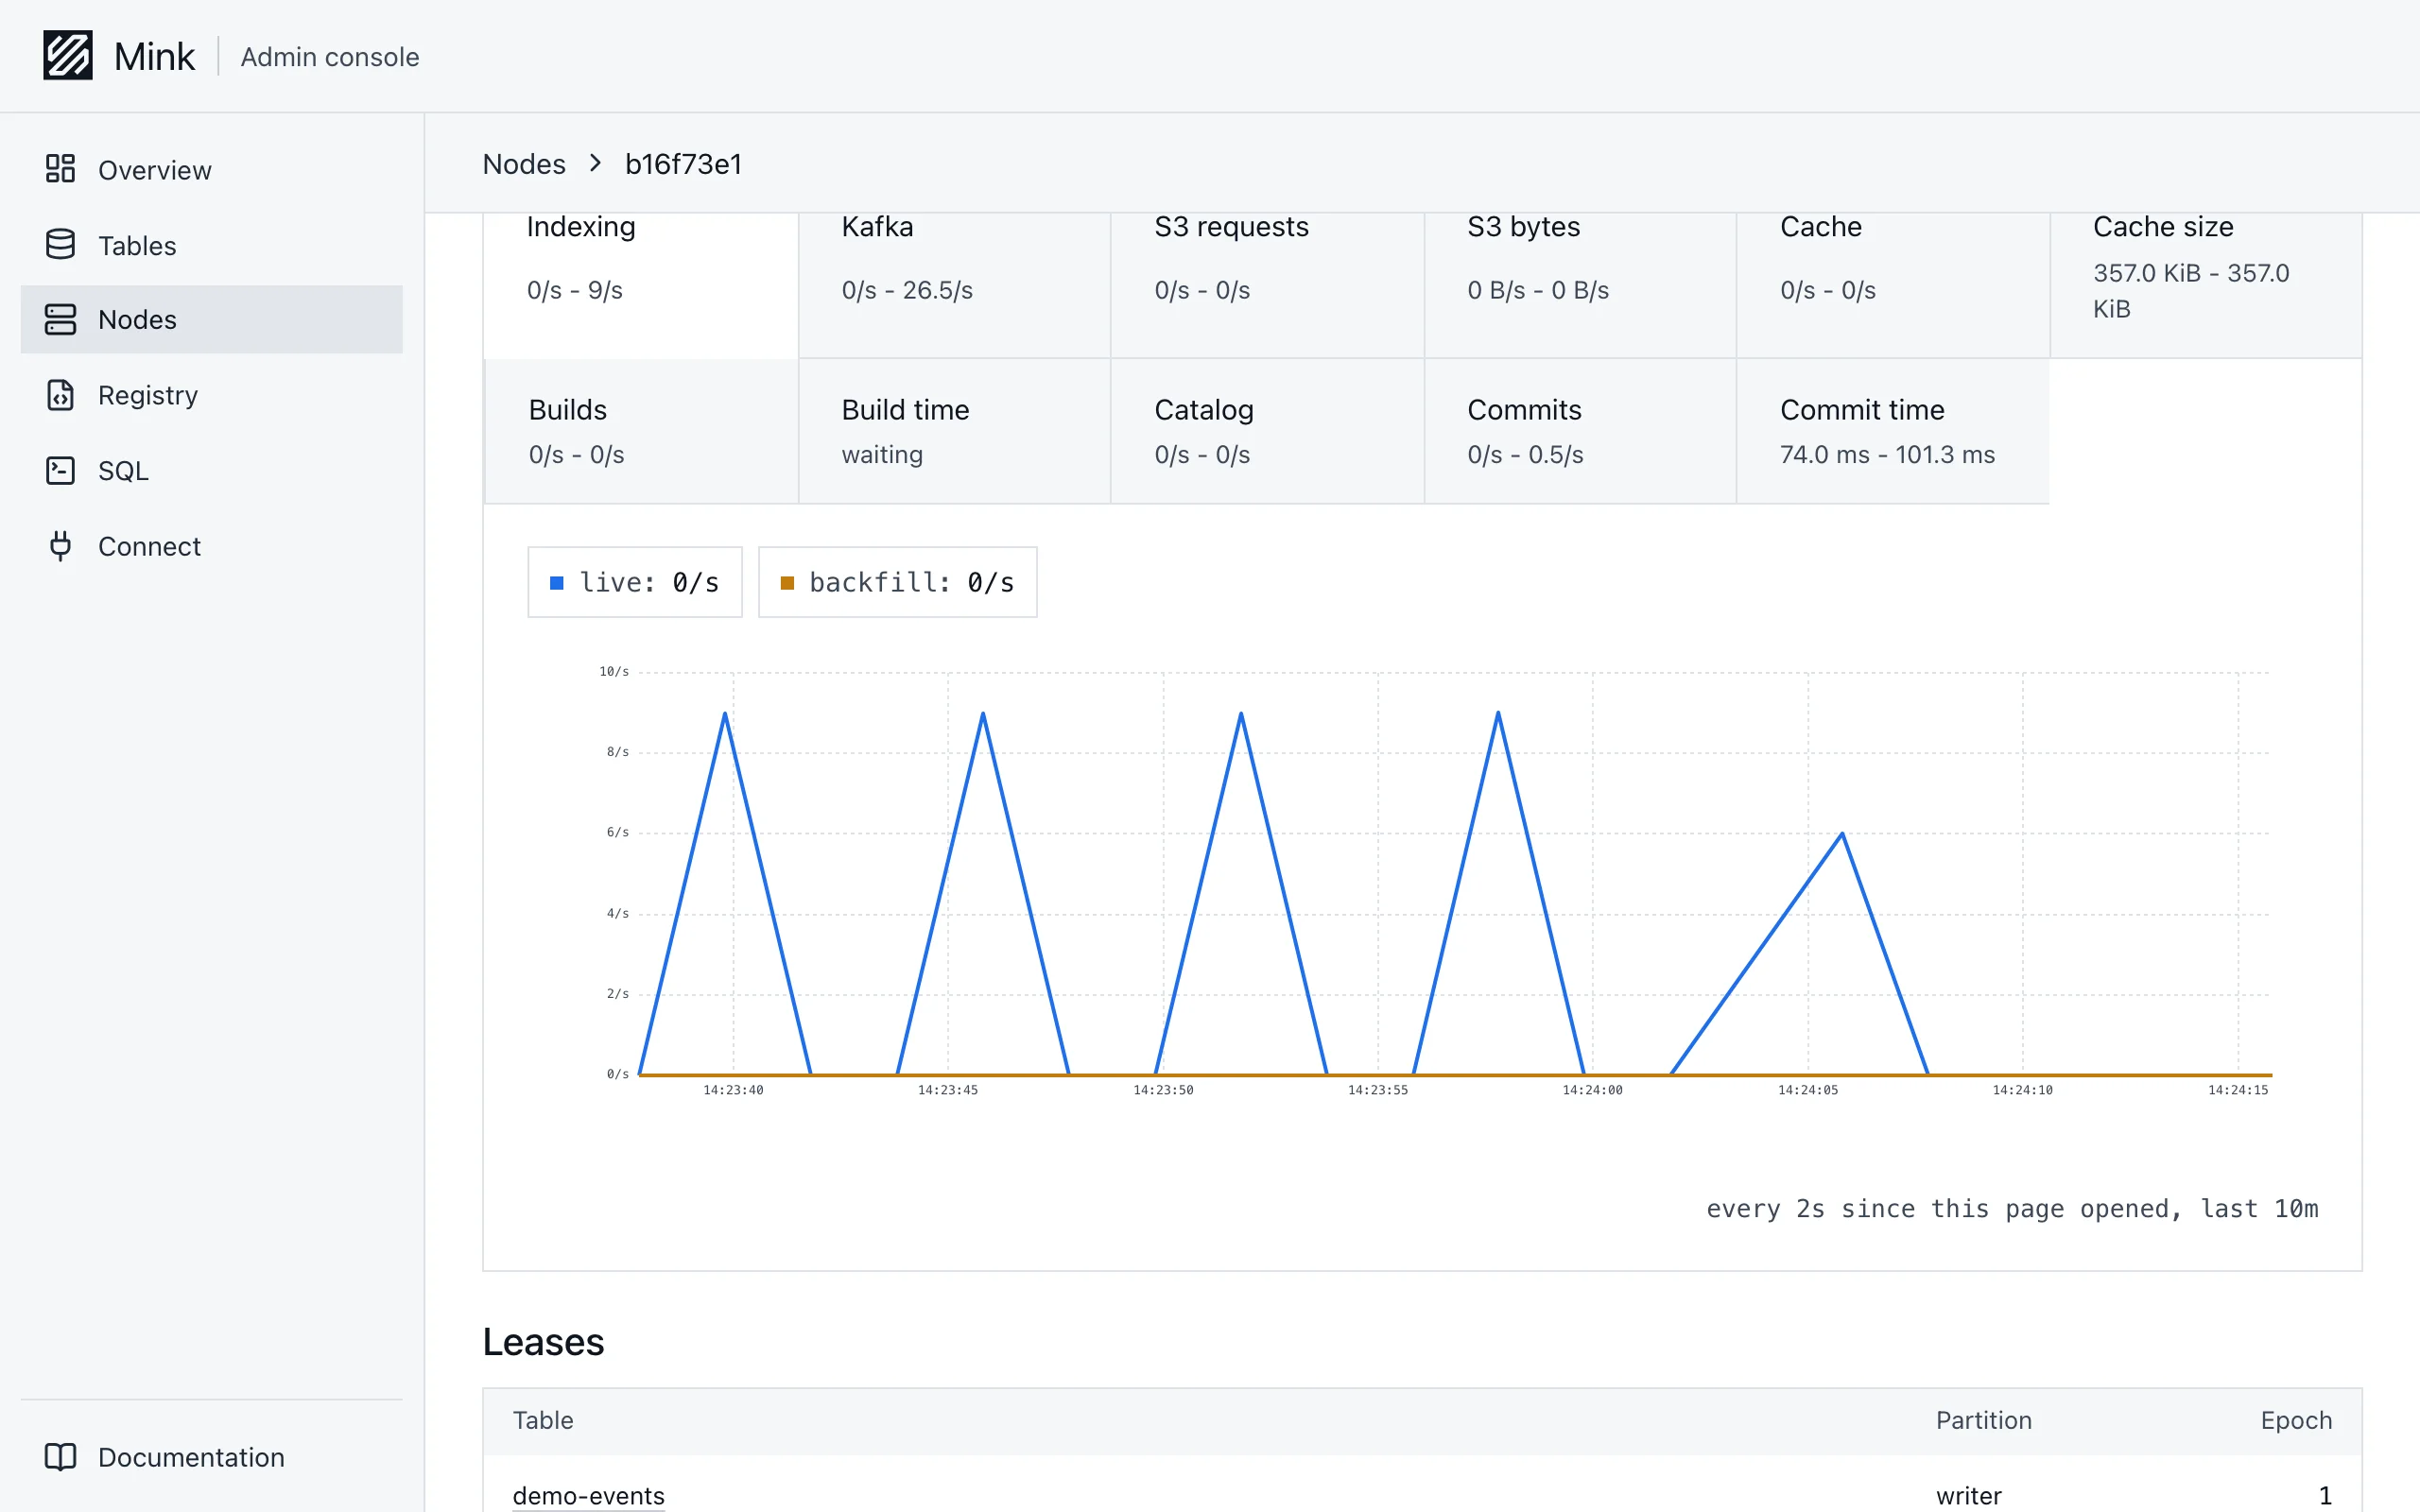
A node's page shows its roles, leases, cache use, addresses and settings, with secrets redacted. It charts indexing, Kafka requests, S3 requests and bytes, cache hits, cache size, builds, catalog requests and commits. It samples the node's metrics every 2 seconds while the page is open and keeps the last 10 minutes.
SQL
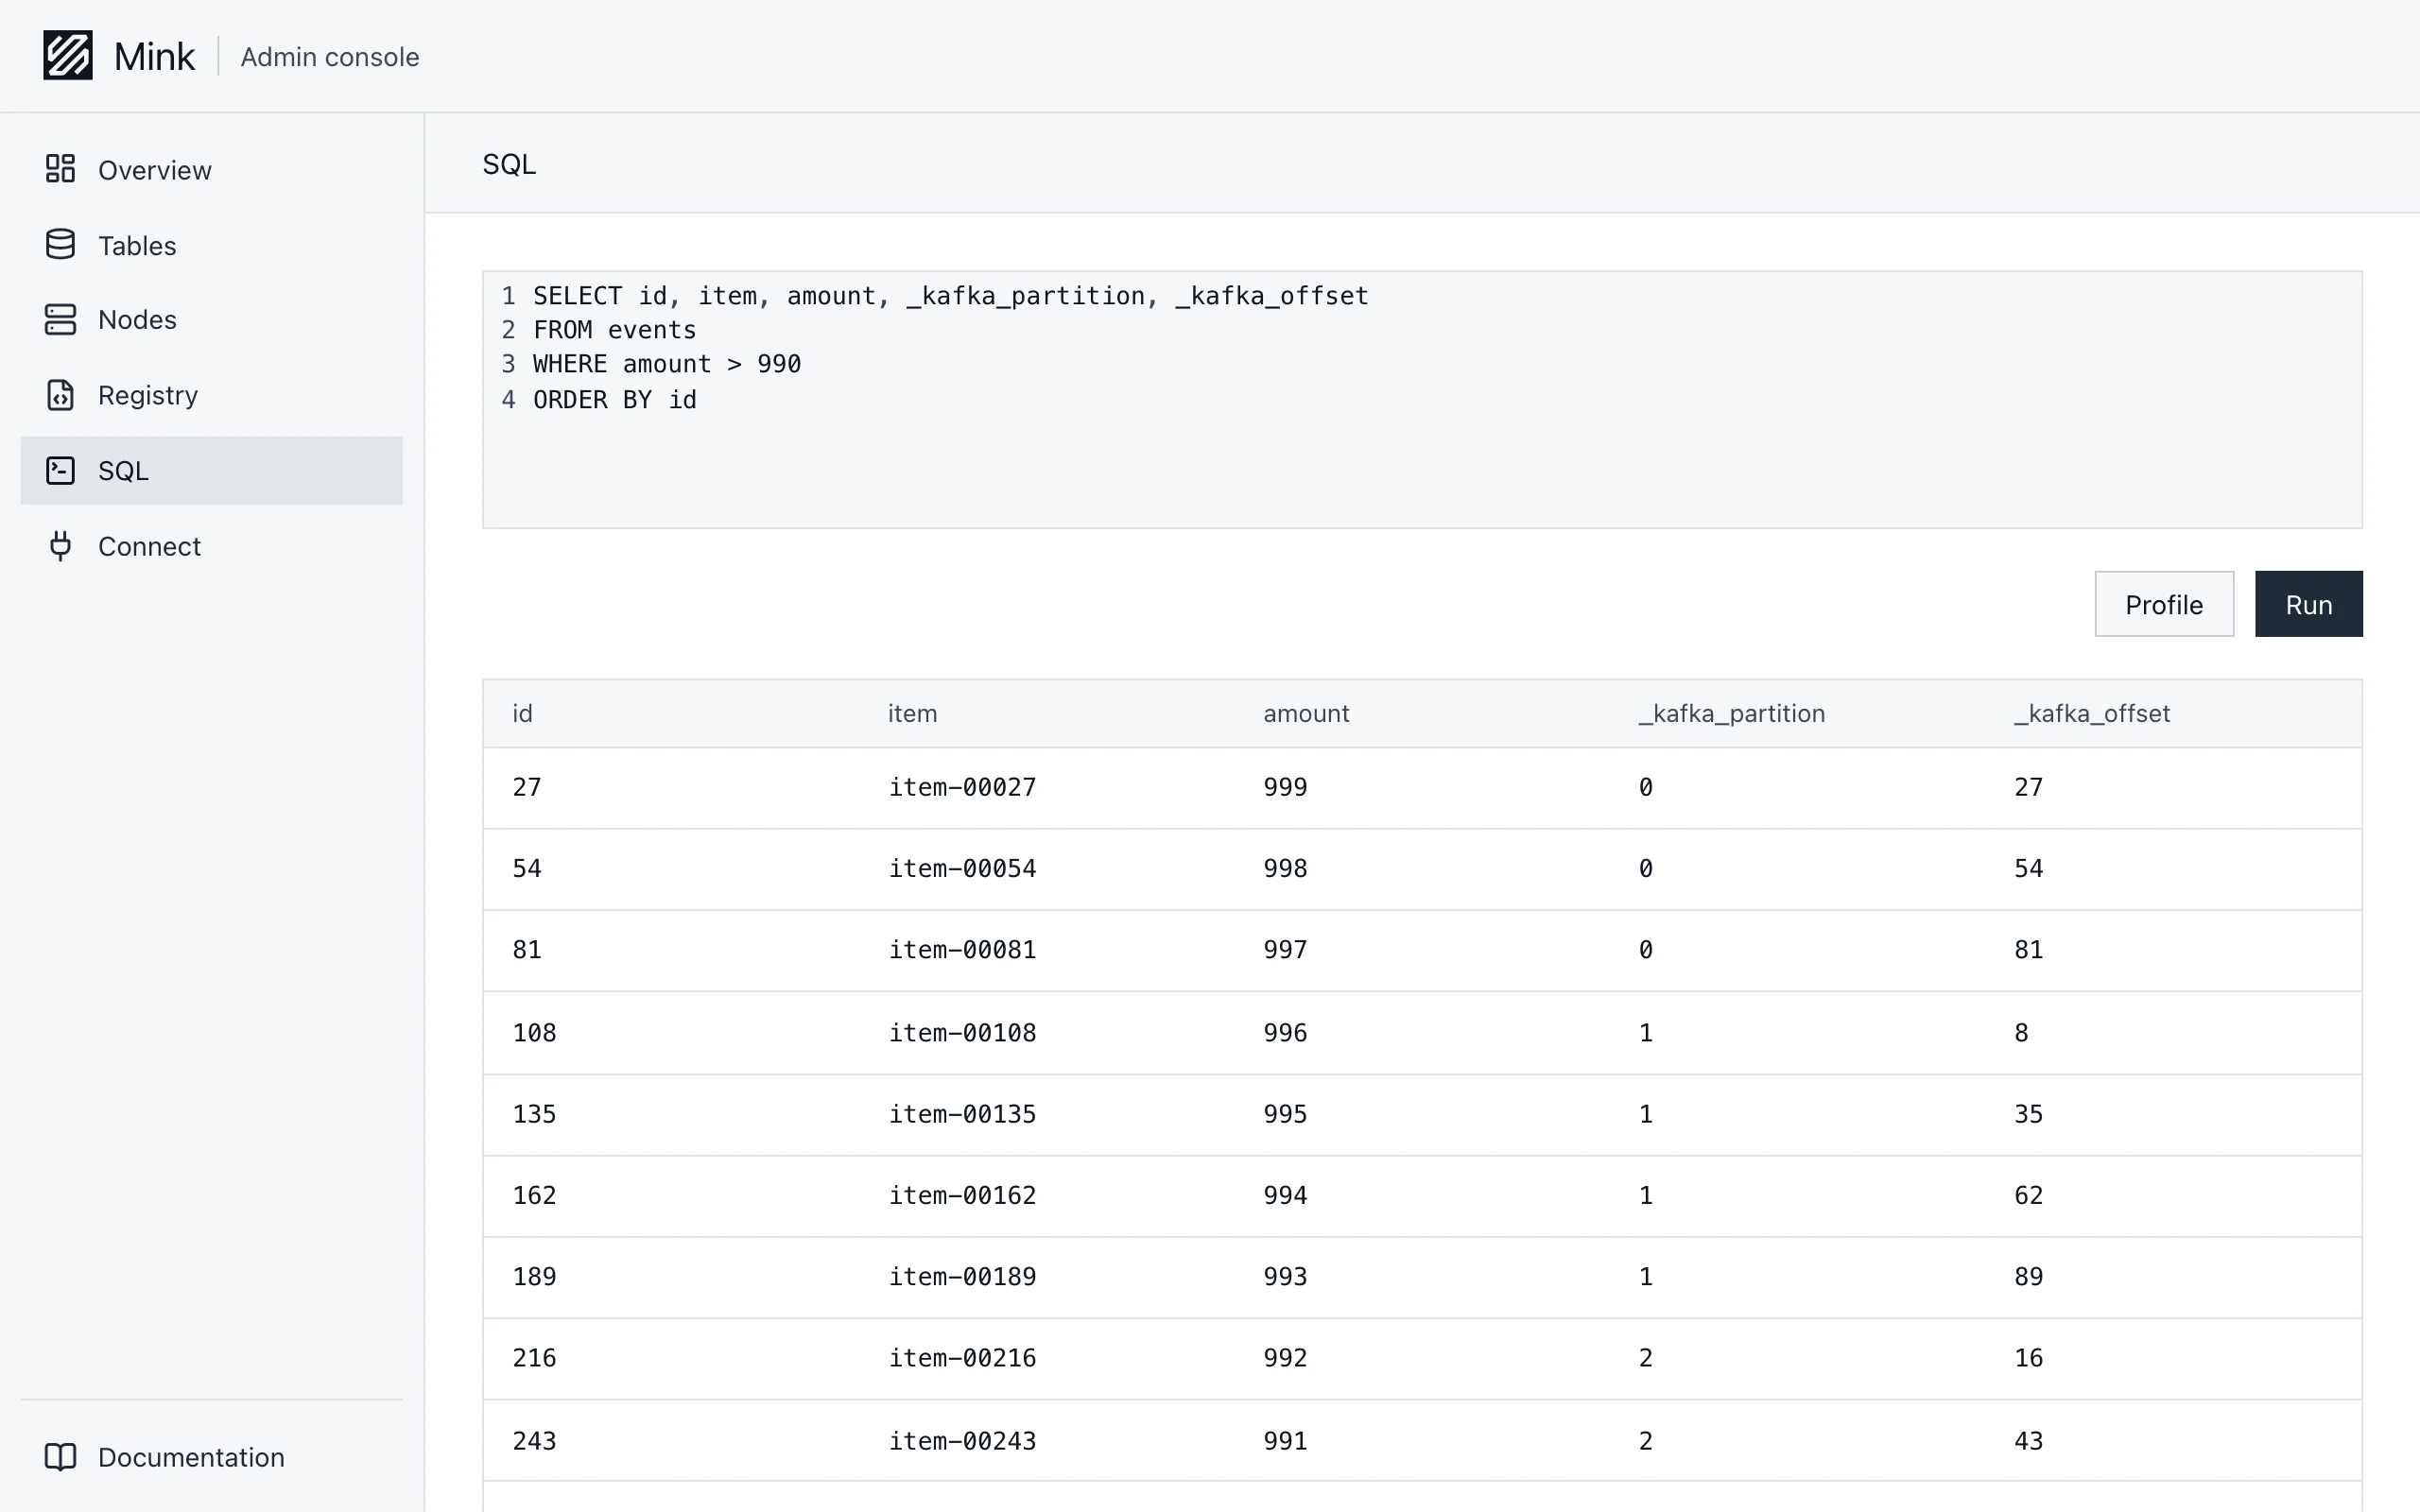
The SQL page runs DuckDB-Wasm in the browser. DuckDB attaches this node's catalog, with its namespace as the default. It reads through /catalog and /s3 on the admin listener, and needs the catalog and s3 roles on this node.
- Run. Runs the statement and shows the first
1,000rows.Ctrl+Enter, orCmd+Enteron macOS, runs it too. - Links. The statement is kept in the URL, so a link opens the same query.
- Engine. DuckDB loads from jsDelivr, and its extensions from DuckDB's repository.
duckdb_engineandduckdb_extensionspoint both at a mirror, see Configuration. The page runs only DuckDB files whose hashes match the version the console was built with.
Profile
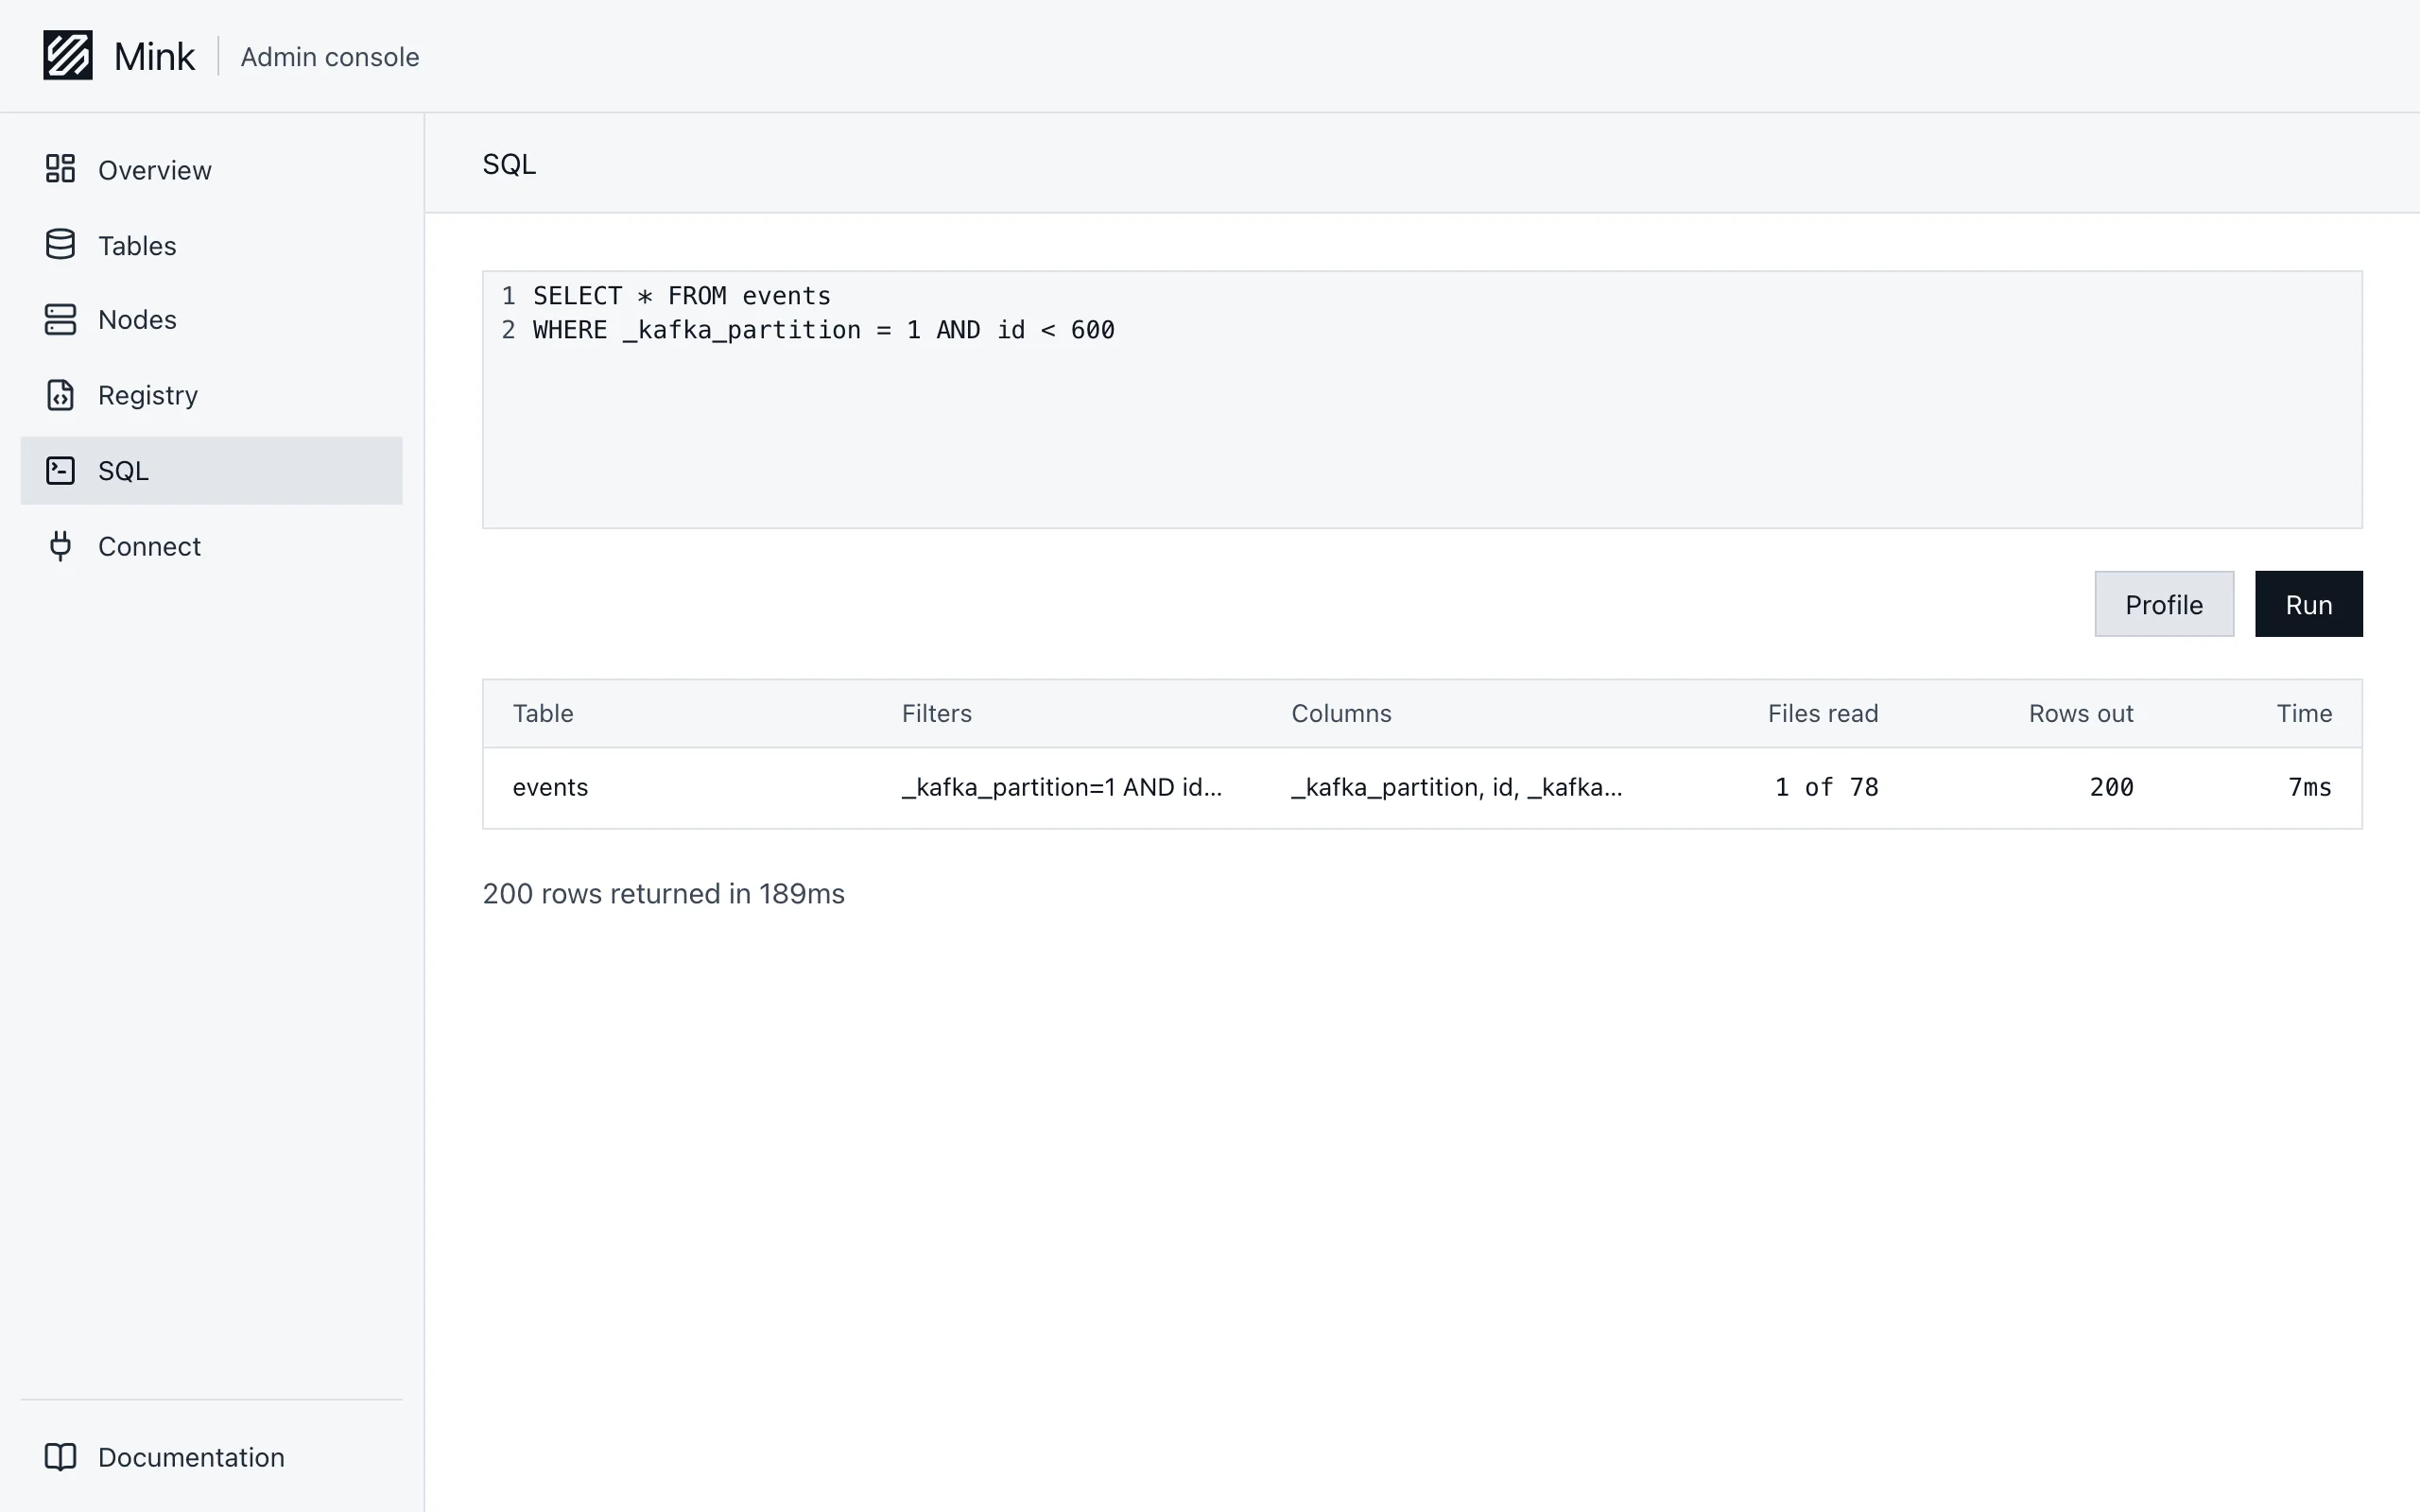
Profile runs the statement and shows each Iceberg scan instead of the rows.
| Column | Shows |
|---|---|
| Table | The table scanned |
| Filters | The filters DuckDB pushed into the scan |
| Columns | The columns read |
| Files read | Data files read, of the files in the snapshot |
| Rows out | Rows the scan returned |
| Time | Time spent in the scan |
Files read shows how much a filter prunes.
Connect
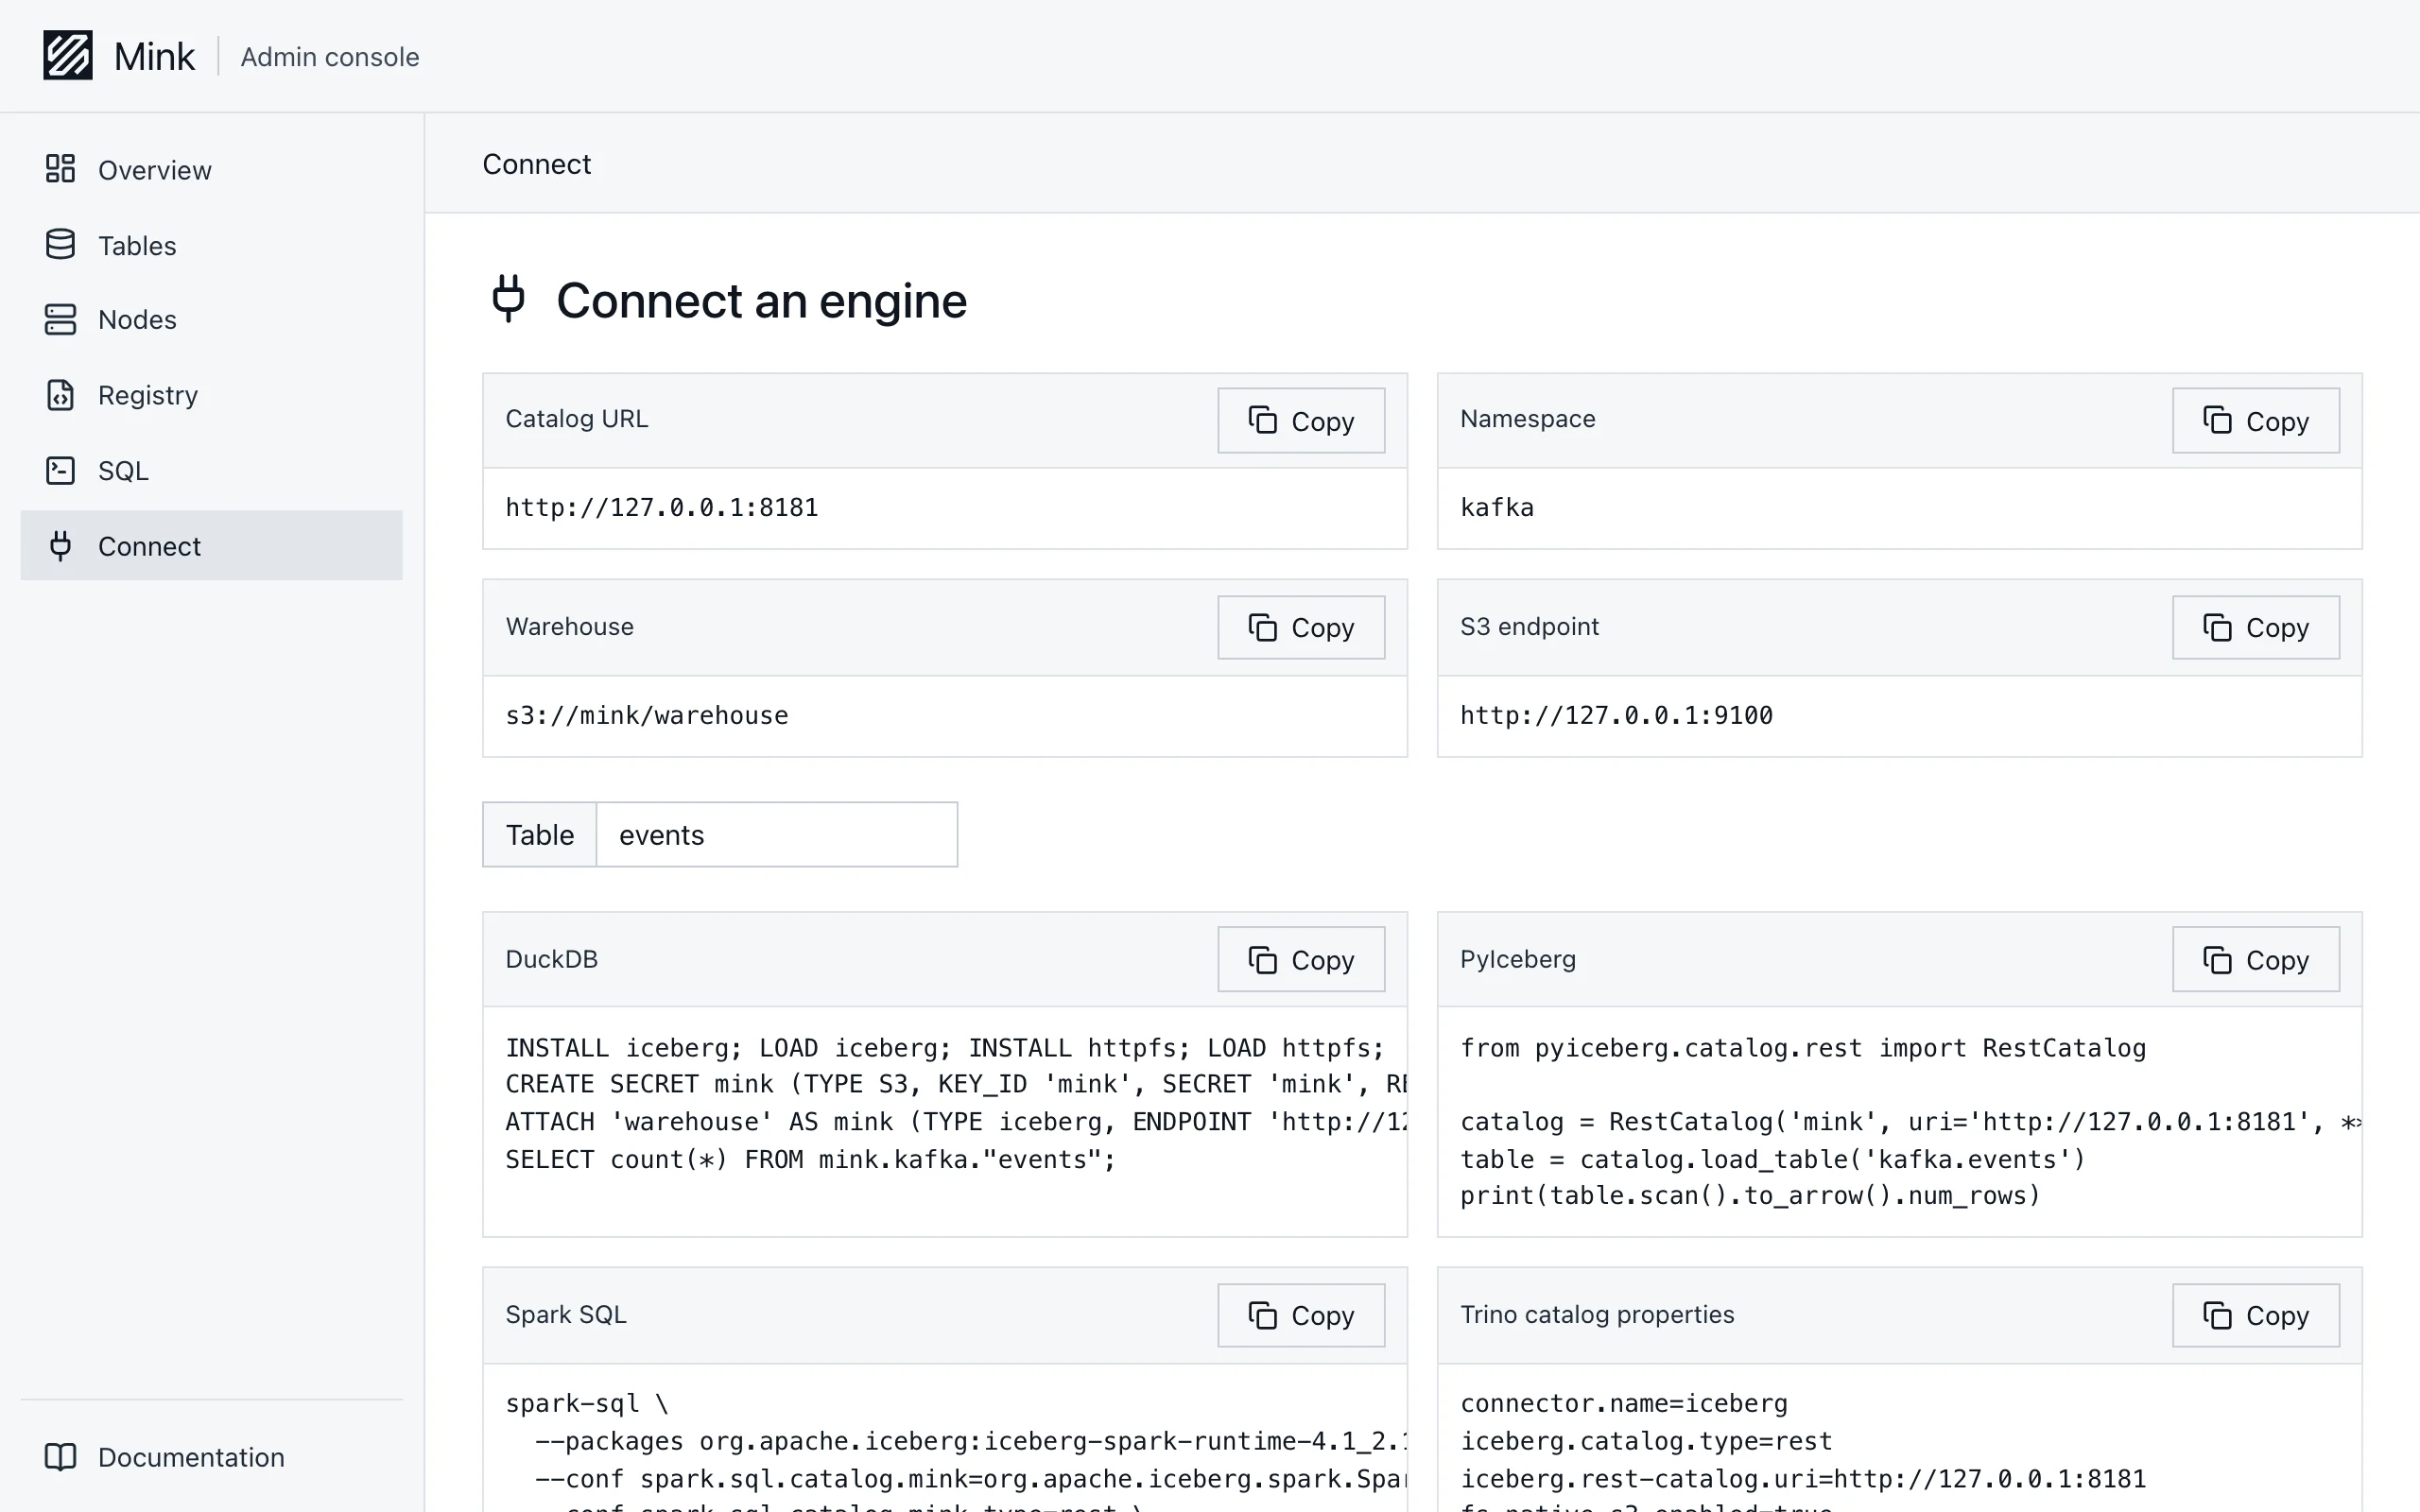
The Connect page shows the values an engine needs, with a copy button on each. Naming a table fills it into the examples. The values come from catalog_endpoint, namespace, warehouse and s3_endpoint. Set those to the addresses engines reach. See Engines.